Code-Native
Data Privacy
Embed privacy controls in your application code to detect PII as it enters and leaves your systems, preventing it from reaching unintended databases, data streams, or pipelines. Build trust by eliminating the unknown.
Get started with Streamdal
curl -sSL https://sh.streamdal.com | bash
For installation instructions, check our repo here

10x faster,
10x cheaper,
and 10x easier
to operate
than traditional data pipelines.
Built with experience from


Integrations
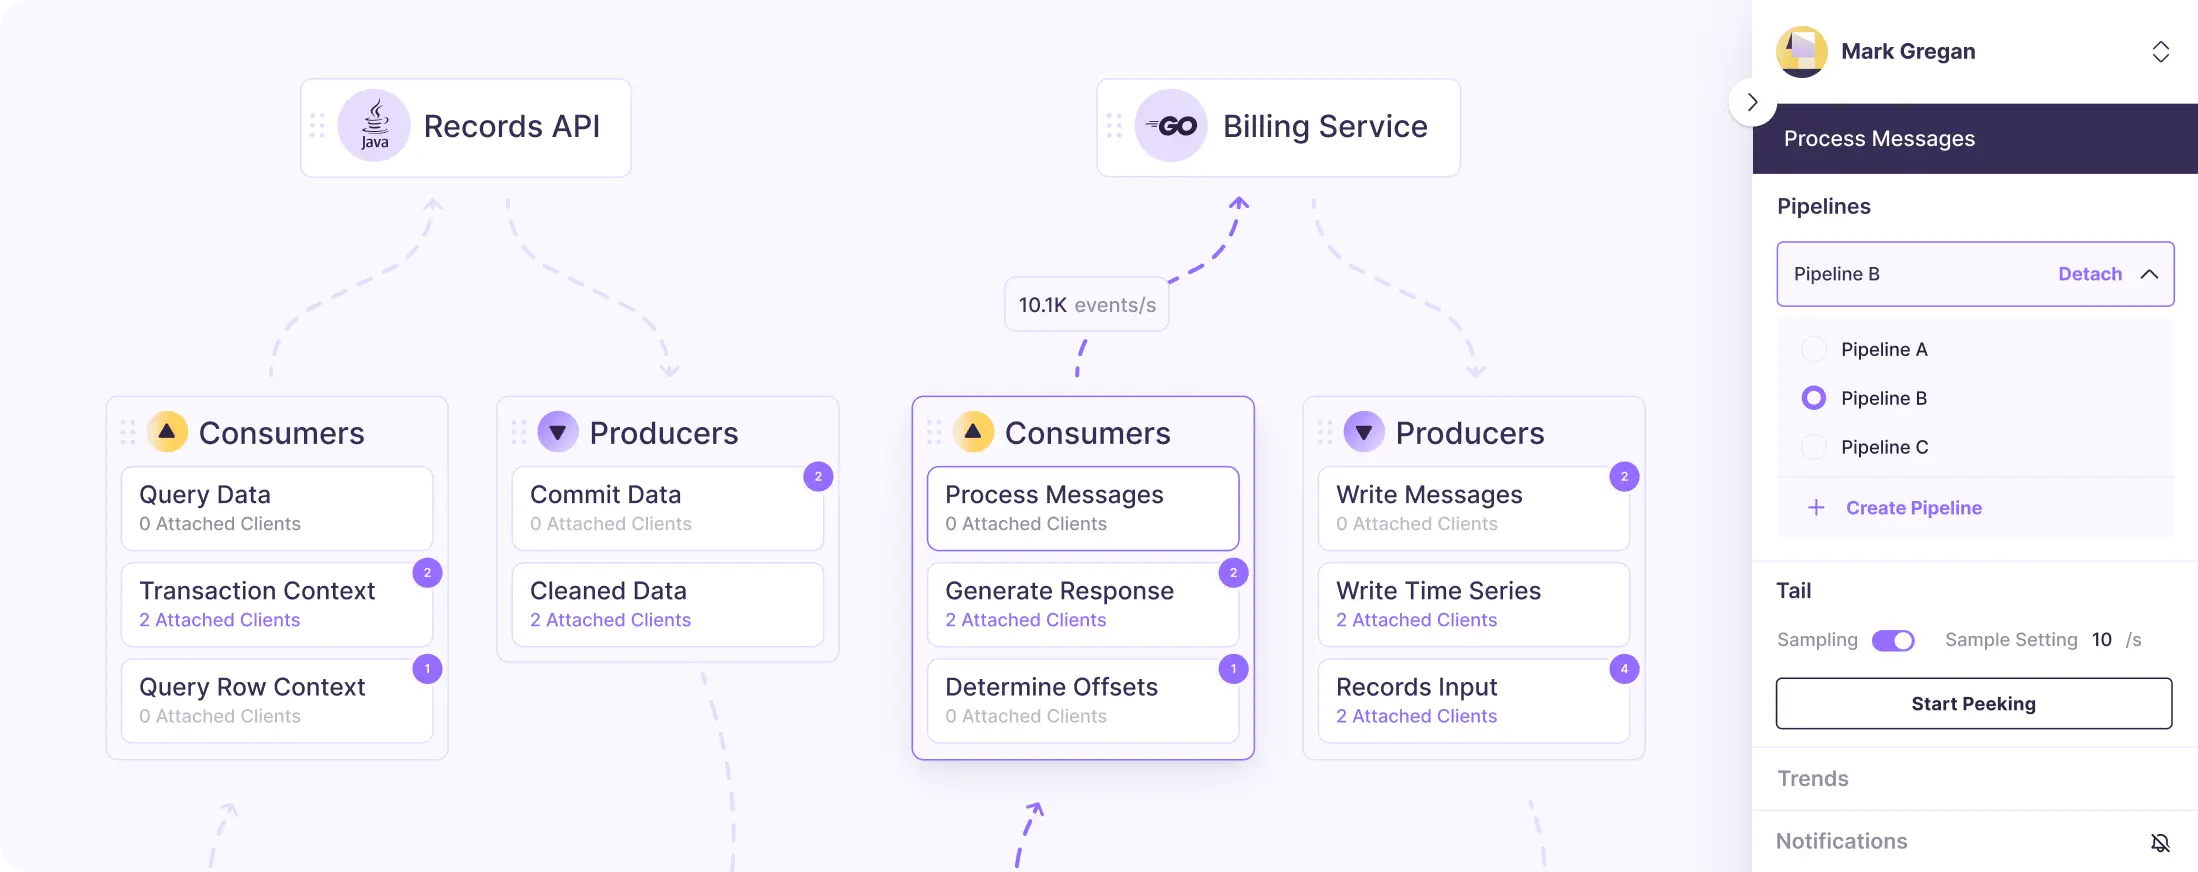
Streamlined Integrations for Enhanced Data Privacy
Embed data pipelines as composable pre or post processors to validate and secure data in real-time, preventing unintended PII/PHI exposure, ensuring data integrity from the start.
Manual Instrumentation
Manual Instrumentation
Enhanced SDKs & Extensions
Batch or Streaming Integration
CLI & GUI Accessibility
Deployment Flexibility
Manual Instrumentation
Empower your applications with real-time privacy controls to manage application data flow. Streamdal supports common programming languages, allowing your team to implement robust data handling with ease.
Join our journey!
Hi I’m Ustin, the CEO of Streamdal. We’re passionate about data privacy and we’re committed to build the best solution for our community.
Wan’t to help? Let’s hop on a call and let us demo our product. We’d love your feedback!
Enter your email to stay posted on news