manifesto

Word from the Founders

Hey there, Dan & Ustin here!

You might be thinking "Another observability product... kewl...". Well, here's the thing, we think it's so different in both the approach and in what it enables you to do, that it probably deserves its own category. It is seriously sweet and we think you'll agree.


Origin

Since the first day that we started Streamdal (back then, it was known as Batch), both of us wanted to make it easier for engineers to work with complex systems. Whether it was to enable better observability for event-driven and event-sourced systems or to detect schema problems in complex datasets - it’s always been about the same thing - empowering the engineer to be able to make quicker and better decisions. Because, well, we’re engineers and we build stuff that we wished we had.

But here’s the thing - all of the stuff we built at previous companies (and all existing observability solutions) suffers from the same problem - it tells you that a problem has occurred AFTER it has already occurred. Wouldn’t it be awesome if you knew that something is busted BEFORE it impacts your system? And if you want to prevent something from happening, you probably also need to be able to see it right now, not after a three-minute delay or having to redeploy your service.

Metrics, traces, and logs all have their place but they are not able to give you that instant, real-time answer about what data your app is processing at this exact moment.


That is the premise of why we ended up building what we built - we wanted to create a suite of tooling that is ultimately preventive, instead of reactive.

Whether we like it or not, and despite all of our best efforts, everyone’s career involves fighting fires. It would be really nice if we could reduce the need for firefighting.


But in order to be able to prevent bad stuff from happening - you probably first need to be able to observe it. And that’s exactly why we started with tail. So that’s exactly what we built, except with many more (hopefully helpful) features.

Let us explain what we mean by that.

What We Built

We have built an open-source observability tool called “Streamdal”.

Aside from giving you the ability to tail -f parts of your app that are processing data, it is also an engine that allows you to execute rules like “payload should not contain XYZ”, “mask sensitive data”, or “alert me if data contains PII”.

At its heart, Streamdal is a server, a UI, and a bunch of Wasm-powered SDKs. Alone, the pieces are not too impactful but using them together provides engineers with a new level of observability and enables them to prevent issues before they turn into something more serious.

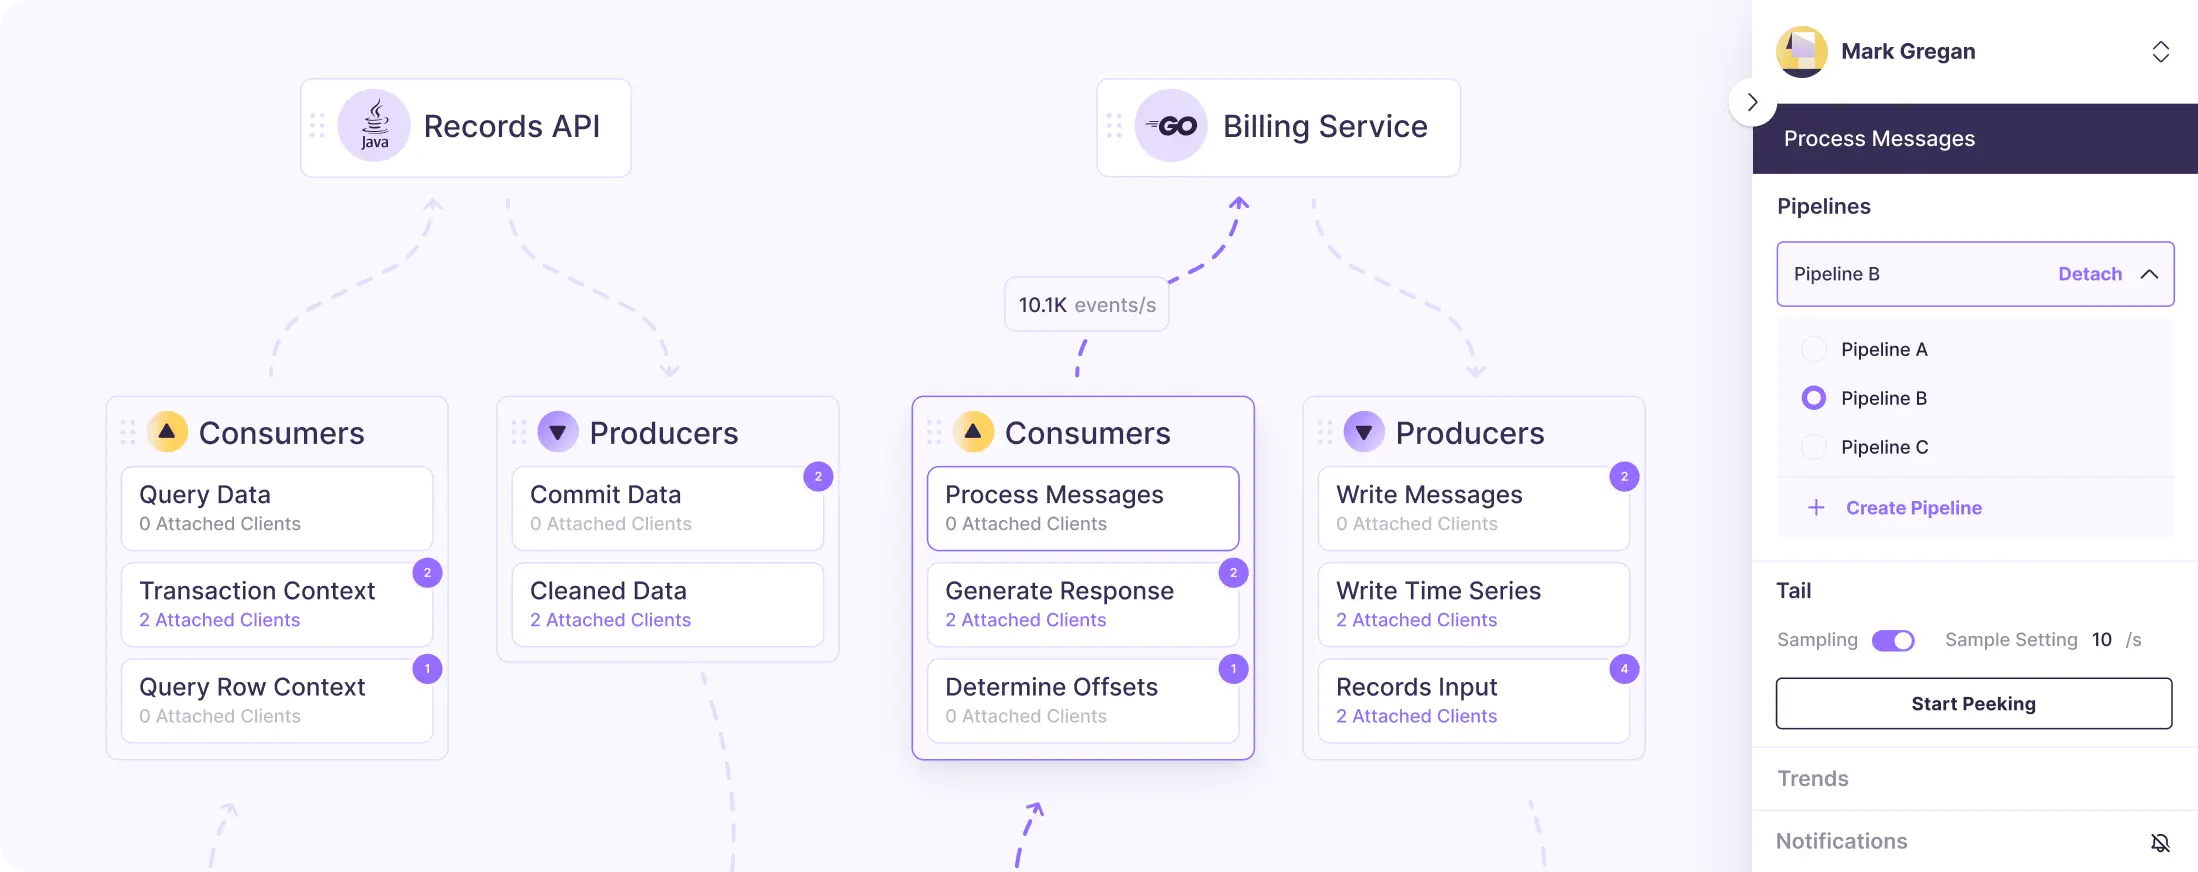
Specifically, what you get is a beautiful UI with a real-time data graph (think: Figma), that shows you your apps and services, their dependencies, their respective throughput, and inferred schemas, all while allowing you to tail -f any component. And all of that is really real-time, with zero lag and zero delays.

Here is what it looks like:

Dashboard
Crow chat

You can read more about the functionality of Streamdal in our docs.

Why We Built It

This one is simple.

Because metrics, logs, and traces are not enough.

Because seeing what a service is doing right now is unnecessarily difficult.

Because we want to prevent fires and not put them out.

Because real-time observability should not be complex.

And finally, because:


“Real-time observability” is not actually… real-time.


Observing what data software is reading or writing in real-time has always been a huge pain.

We’re talking about things like “Show me the data I’m reading from this API” and “Show me the data I’m writing to this database”.

When observability is not real-time and does not enable visibility into your data, issues take longer to diagnose and resolve. Outages are longer. Your customers grow more and more unhappy. And your company is losing out on revenue while you wait for logs, dig through traces, or guess at the why based on metrics.

Better APM, metrics, and tracing cannot solve this.

These tools can show us how the software is doing but they won’t be able to show us the exact data being produced or consumed in the moment.

Logs cannot solve this.

Even when a log tool claims to be “real-time,” there’s always a delay before logs become available.

That’s not real-time observability. That’s fairly recent observability.

Even the best of “fairly recent” observability is complex.

Especially when running in a high-throughput, production environment with 50+ services that generate millions of log entries per day. It will be slow or in a perpetually falling state and a never-ending nightmare for your SRE team.

But if you have figured it out and your logging is fast, adding extra log statements to your code will require you to:

  1. Make code changes + commit your code
  2. Open a PR + review
  3. Build + deploy it to prod
  4. …and then probably do it again, because you didn’t log enough. And then, an hour or two later, you’ll probably be done. Maybe you even remembered to remove the extra log statements from your code (which would require another re-deploy…).

You’re still chasing and putting out fires, not preventing them.

All of this tooling helps detect a problem, but none of it solves the issues or prevents them from happening in the first place.

So what we all really need is a tail -f for your data with a UI, paired with rule sets to prevent bad data from ever being produced. And that’s exactly what our team built.

We built an open-source, real-real-time observability solution that enables engineers to peek into the data that their applications are consuming or producing - a tail -f with a beautiful UI. With pre-defined or custom rule sets to enable preventive observability.

Crow chat

The possibilities are endless - get inspired by looking through some other use cases.

What Makes This Special

There is one very important distinction that makes our approach unique (and we think quite superior) to traditional observability approaches:

Everything happens client-side

What does that mean? Traditional observability solutions will ship metrics, logs, or traces to some central location (sometimes along with a hilarious bill), have the data inspected and then, potentially alerted on.

With our approach, there is no shipping anything anywhere - the logic to decide whether something should be alerted on happens entirely client-side, defined as rules (that are shipped down to the client as Wasm modules, by the Streamdal server).

The magic word is “Wasm”. It is a huge part of what makes all of this possible.

  • Wasm allows us to write “generic” SDKs that execute Wasm modules that contain the actual business logic.

  • Wasm is the reason why most rules take less than 0.05ms to run.
  • Wasm will enable users to write their own Wasm rules, in their preferred language.

Wasm is at the heart of this product and we are infinitely thankful to all of the folks working tirelessly on making Wasm more accessible. Thank you, for real.

Crow chat

If you want to learn more about the inner workings of the server and the SDKs, head on over to our arch docs.

Our Promise

Here’s something annoying. There has been a fairly significant uptick in the number of companies that do this “pump and dump” type of open-source.

As in, they write something, release it, gain traction, and then promptly make previously “free” features into “paid” features. It’s rug-pulling.

We hate that.

So we’ll try to be as clear as possible:

Observability features will always stay free

Vision

Step 1 is observability features

Streamdal will enable folks to observe what data their code is processing, gain insights into throughput, schema usage, bottlenecks, and all kinds of other info in real-time.

We are here right now (Oct 2023).

Step 2 is lots of SDKs

We think that everyone could benefit from using this platform but for that to happen, we must support many more languages. Right now, we’ve got support for Go, Python, and Node. But we’d like to see support for at least another 4 or 5 languages, at minimum.

Step 3 is shims

SDKs are nice but it requires folks to update their code and “wrap” their data processing calls with our SDK. We think it would be much nicer if we created “wrapper” libs for popular libraries like Segment IO or Kafka for Go or Requests for Python, which are already configured to use the Streamdal SDK.

This means that adopting Streamdal would only require importing a library. We think this is going to be massively beneficial for a huge set of users and will help expose this tech to more users.

Step 4 is preventive features

The current (Oct 2023) release of Streamdal contains rule capabilities but they are in beta. This is the stuff you can use to modify your “in-flight” data such as stripping PII, masking, obfuscating, or validating that data is of a certain format or structure (Valid protobuf? Valid JSON schema?).

It is in beta right now because we haven’t put it through its paces. Our primary focus so far has been observability. The “preventive” features can be thought of as a tech-preview.

And after that? That’s pretty far out and you should probably consult the roadmap. 😄

Outro

We hope this fairly long essay was able to provide you with a bit of insight into us, the sort of folks we are, and our overall vision for Streamdal.

What do you think about the project? Do you agree or disagree with what we said? Do you have some 🌶️ opinions? We would be delighted to hear from you!

The easiest way to get in touch with us is to either hop on our public community Discord or email me (Dan) or Ustin.

Thank you for reading this far! You deserve a sticker - email one of us and we’ll get you taken care of!

~ Dan & Ustin

Daniel SignatureUstin Signature
Founders
Circle Bird

Take flight today.

Detect and resolve data incidents faster by peeking into data flowing through your systems and act on it in real-time with Streamdal, the open-source data observability and governance tool.

Star us on GitHub
Product Screenshot